In the previous post, we looked at some of the standard editing capacities devtools provides.
Besides editing, a lot of inspections take place in devtools. In part three of our Intro to devtools series, we'll explore ways we can inspect our application using devtools.
Scroll into view
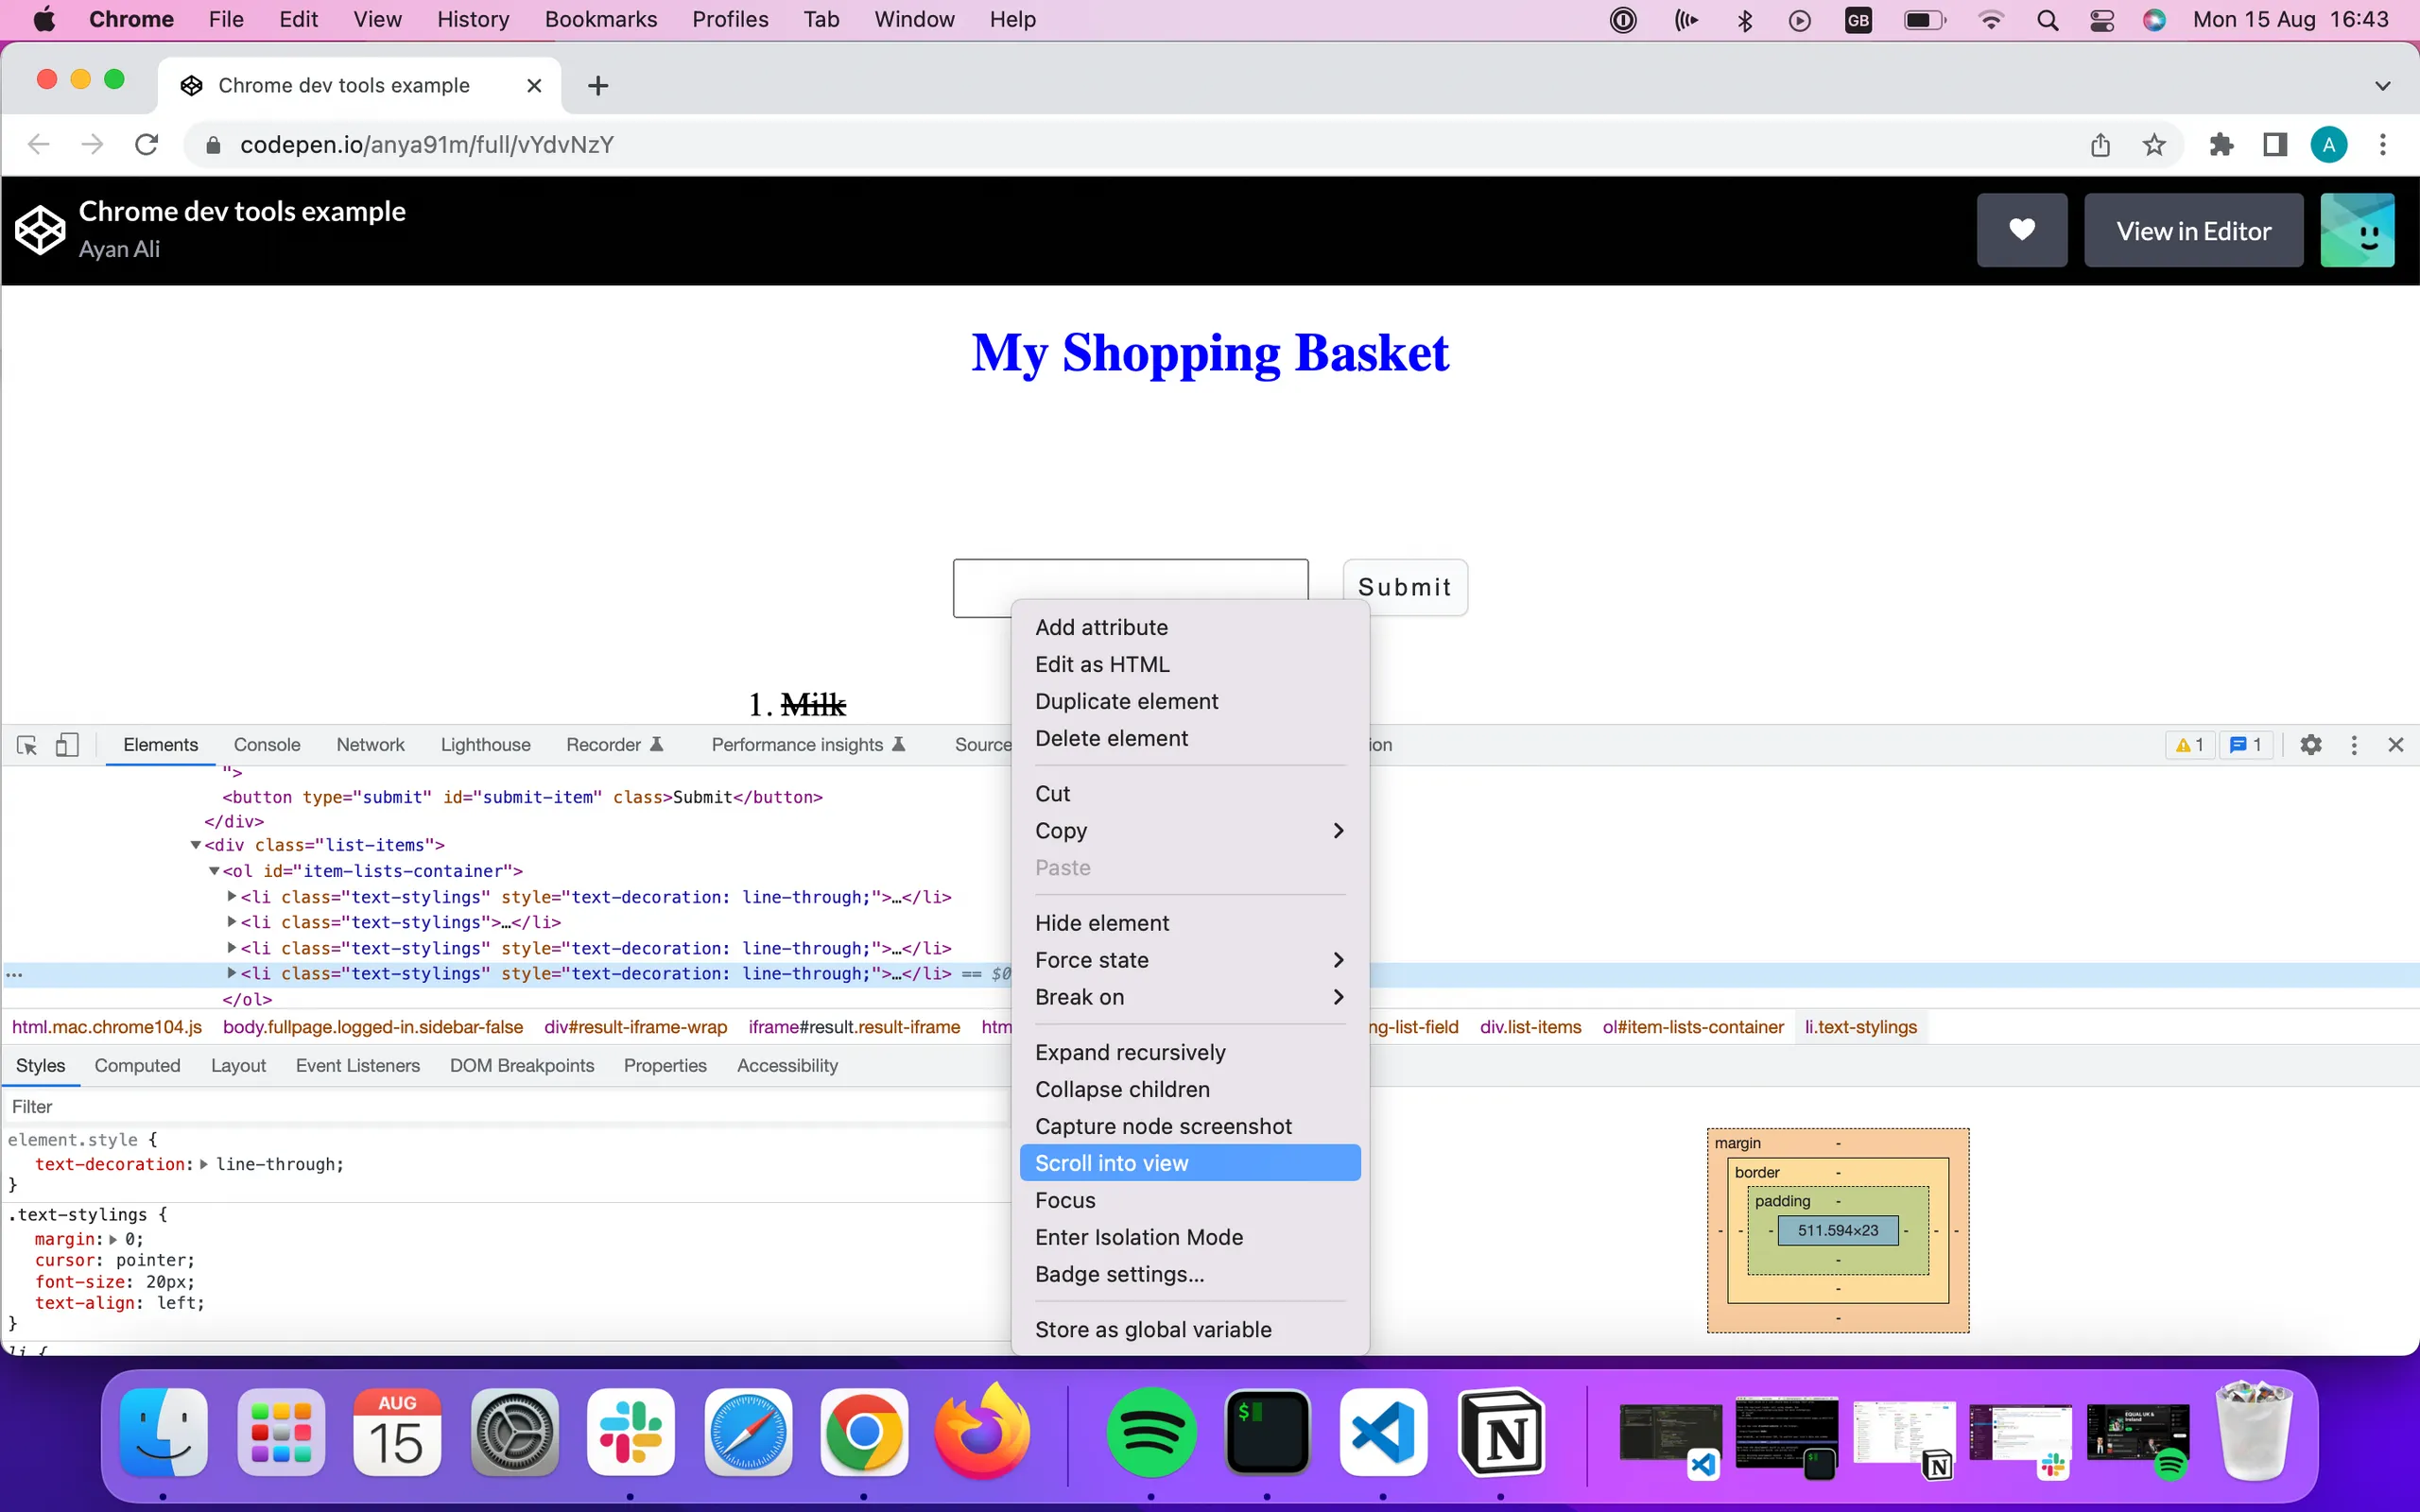
This feature is handy when inspecting an element that isn't in view. You can bring the element into the viewport:
Right-click on the element of interest
Select scroll into view
The viewport will be repositioned to bring into view the node of interest. Scrolling into view is especially useful when inspecting long pages. For example, in the example below, I am interested in a specific <li> node currently not visible on the viewport.

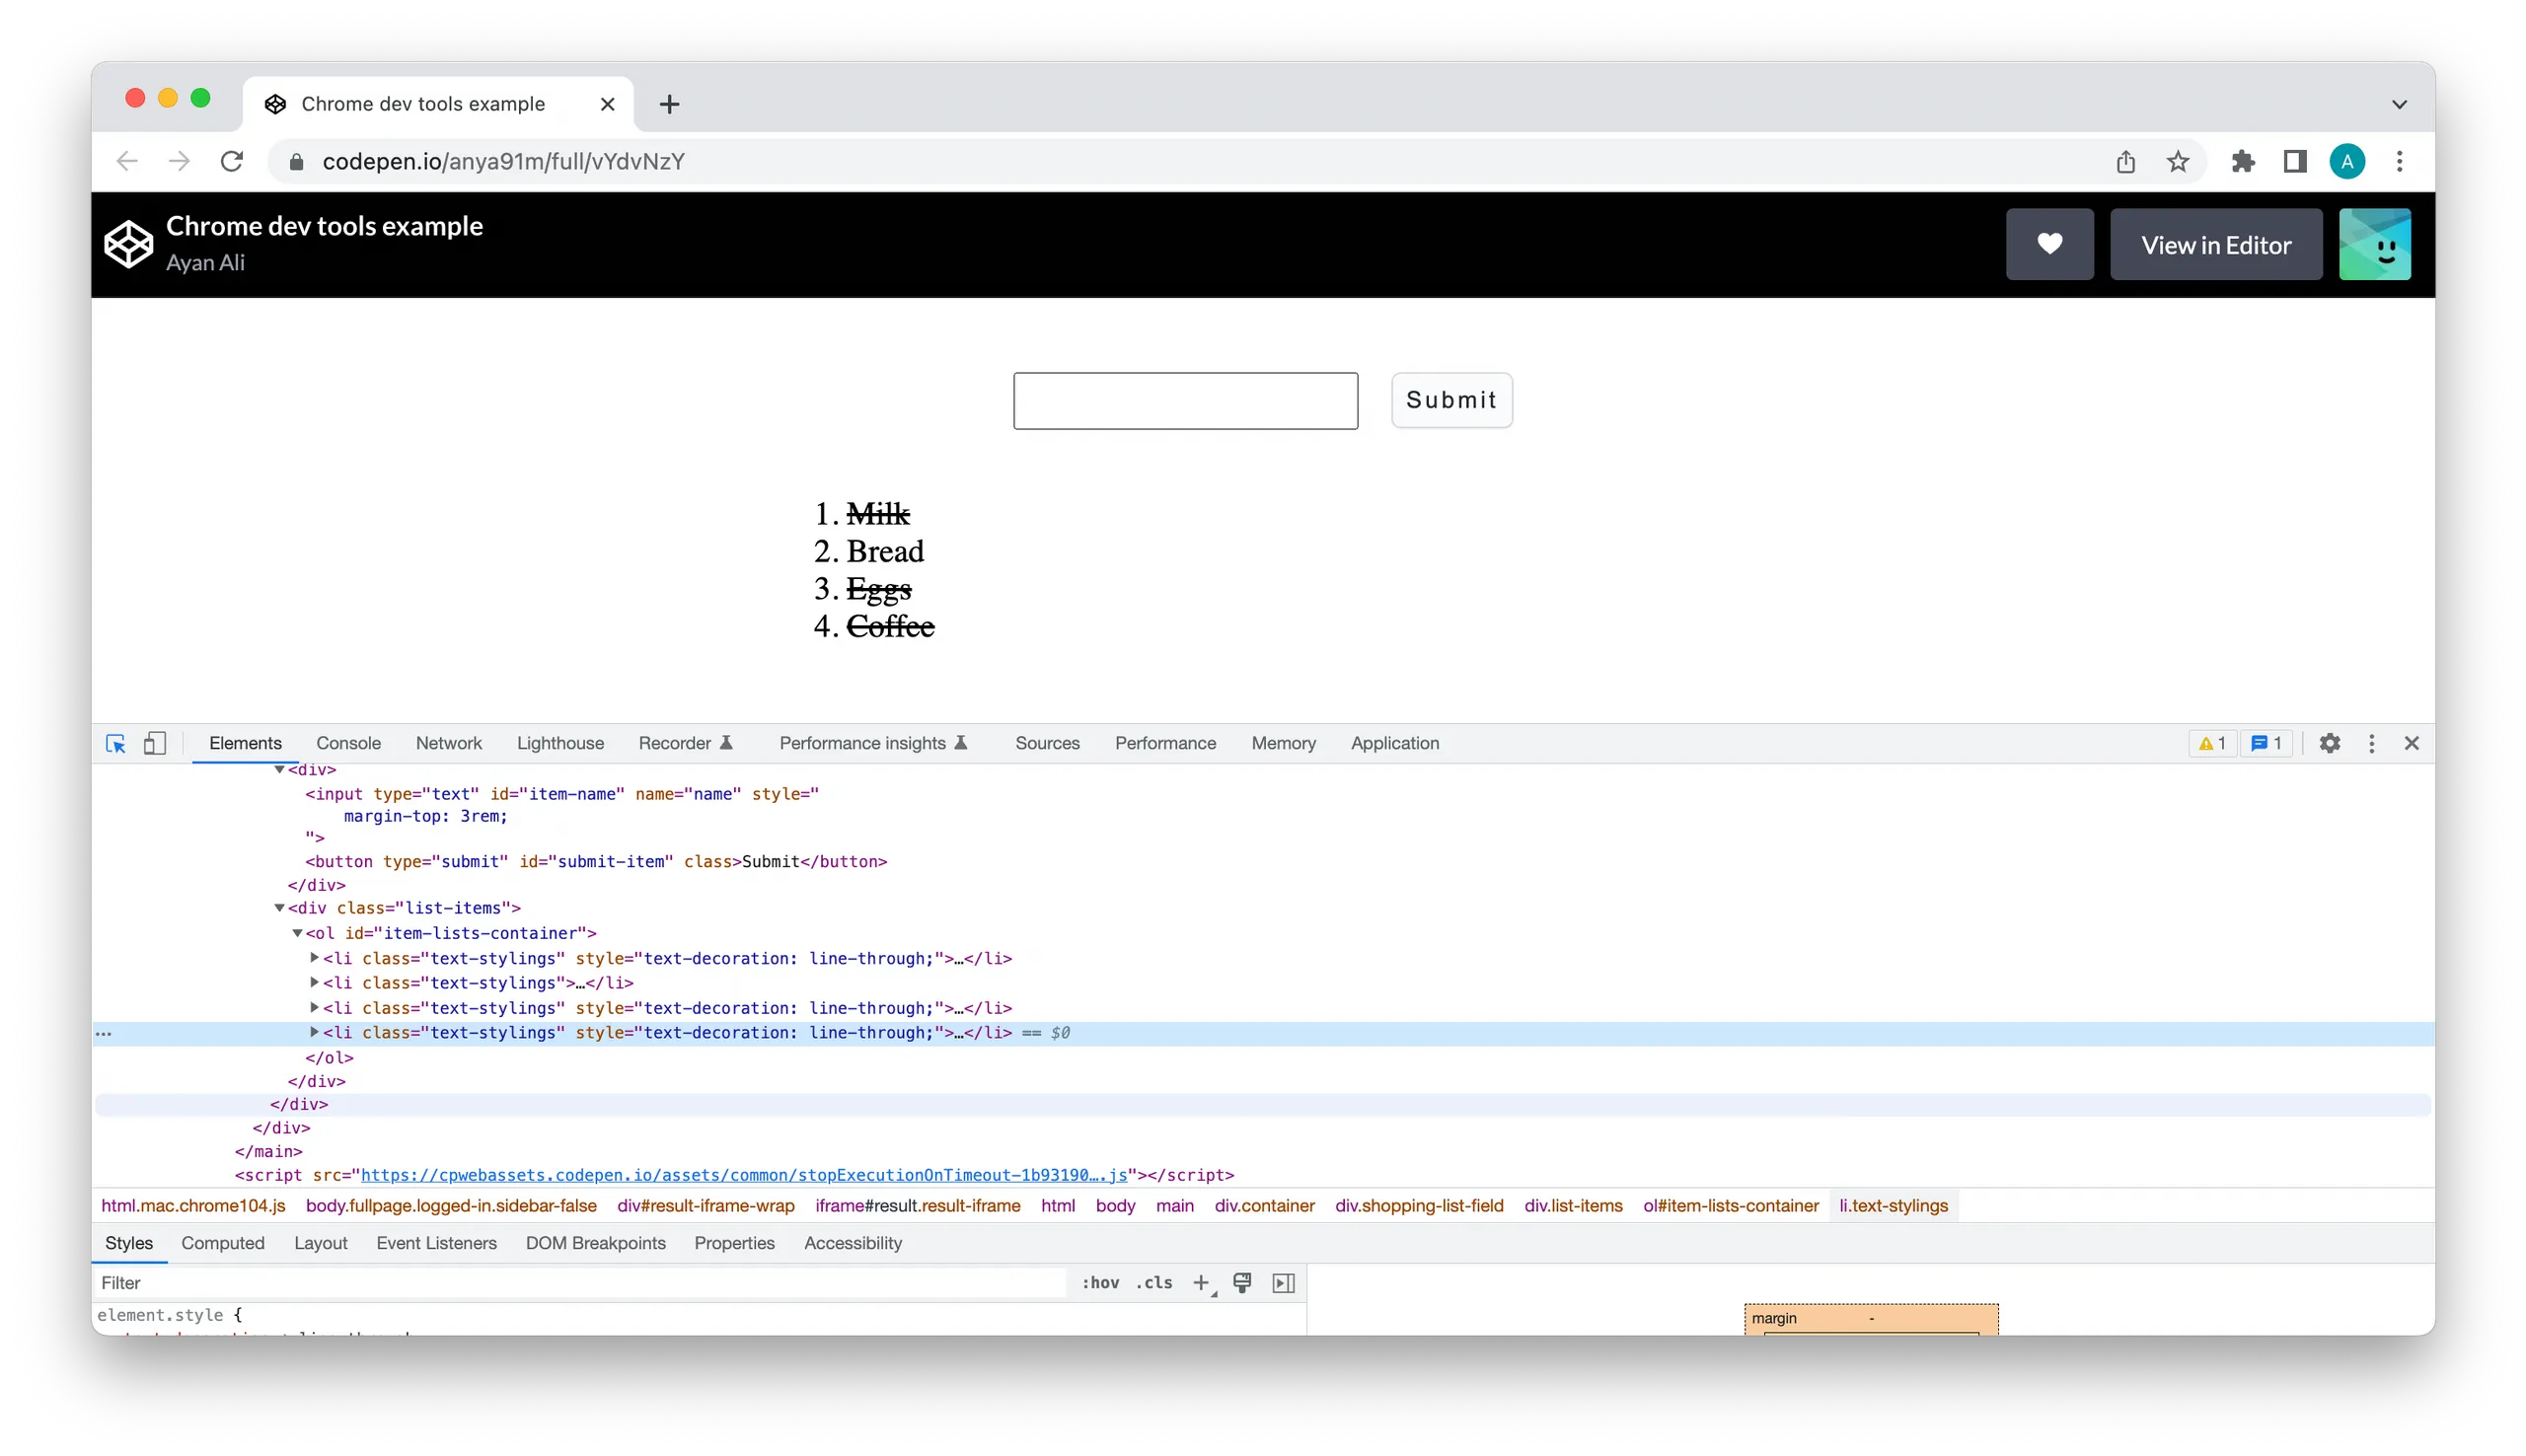
However, by scrolling into view, you can now see the <li> node I am interested in comes into the viewport.

DOM breakpoints
Breakpoints allow you to track different changes to the DOM and find code responsible for modifications - saving you from having to find code lines where DOM events are handled manually. You can set the DOM change breakpoint to pause code that changes a DOM node or its children - this pauses JS execution to show what JS caused the HTML to change.
There are three different types of DOM breaks you can make. These are:
DOM subtree is changed: use whenever a DOM node is added or removed to the app
Node attribute is modified: use whenever a DOM attribute is changed, e.g. adding or removing a class from a node
Node is removed: similar to the DOM subtree modification. However, this pauses JS execution only when a node is removed.
Note that different types of breakpoints exist: DOM change breakpoints, line of code, event listener breakpoints and more. We'll focus on the DOM change and event listeners breakpoint in debugging examples later in the debugging section below.
Sources panel UI
Any JS inspection and edits take place in the console and sources panels. The console lets us view logged messages and provides a JS running environment where we can write and run JS code.
It's in the sources panel; however, we get to see what's really happening in our JS code. Here, we can view our source code files, edit JS and CSS via the editor pane, create and save JS code, set up a workspace, and debug JS.
In the following section, we'll briefly look at the JS debugging pane and understand how it can help us debug JS.
The sources panel UI is divided into the following three parts:
[insert screenshot of sources panel UI]
File navigator - lists all files requested by page
Code editor - displays the content of the file selected from the file navigator tab
JS debugging - various JS inspection tools can be found here
Overview of JS debugging pane
Let's take a closer look at the JS debugging pane to see what kind of tools are available to us here and how they can help us debug our JS code.
Callstack
Shows a list of functions invoked. Once a function is returned, it is removed from the stack resulting in an empty stack.
Scope
Displays local and global scope variables and their definitions.
Breakpoints
A breakpoint is an intentional pause placed at a particular line of code. Here you can set different types of breakpoints and step through your code line by line, viewing the values of variables along each step.
The different types of breakpoints you can set are:
XHR - breaks when server request URL contains a defined value
DOM - breaks when a DOM node or its children is modified
Event listeners - used to pause on event listener code that runs after an event is fired.
It's worth noting that the above tabs won't show any values unless you are actively debugging. We'll jump into doing that in the following section.
A walk-through debugging
Devtools offers handy debugging capabilities. In this section, we'll look at some common JS debugging issues and how debugging in devtools can make debugging that much easier for your next time!
Most people use console.log statements to debug javascript. There are limitations to this approach, as mentioned in part one of this series. Besides, the devtools breakpoint tool provides a more efficient debugging experience. The standard console.log method involves something along the lines of:
Add console.log statements to lines of code of interest
Save the file and refresh the browser
Open devtools and go to console to see output values
You'll often realise that you want to console.log another value, which means repeating steps 1–3 several times.
Let's look at how we can debug on devtools using the tools in the JS debugging pane.
In part 2 of the series, we explored some of the devtools features using our shopping application on codepen. Unfortunately, we find a bug in the application that prevents us from adding an item to the list. We notice that the list item is created on clicking the submit button. We know this because we can observe an ordered list appearing, and upon inspection, we see that a <li> node is created. However, the list content is not appearing.
To debug, we'll need to retrace our actions in the following steps below to understand where the bug stems.
1. Localise the problem
Somewhere upon click, the value is lost.
2. Identify action
We need to find what action is taking place within the localised area. This is the click action, a javascript event we can listen to. Importantly, if we recall the different types of breakpoints, there is an event listener breakpoint available to us in devtools.
Let's go ahead and create one to understand why our content isn't being added upon click.
3. Add eventlistener breakpoint
Open JS debugging pane and head over to event listener breakpoints → open mouse → select click.
4. Trigger breakpoint
Head back to the app and click Submit again. Devtools pauses the app and highlights a line of code in sources tab
5. Inspect app state
Head over to the scope and watch tabs
Scope: this tab shows local and global variables. We're interested in the item variable and see at the current state that this is undefined.
Watch: in this tab, we can console.log and check our variable type. Both indicate that our item variable is not available.
Something is happening to our input value. It's not being captured and added to the list as we want it to, and we can verify this if we step onto line 11 and look into the item variable. We notice that the innerHTML is an empty string, which confirms our suspicions that our input value isn't being captured.
Let's take a step back and check whether we are setting the item's inner HTML before appending it to the list.
We see we're not. So this is the problem!
To test our hypothesis, let's test a solution first in the sources tab as follows:
Add a line of code to set value:
Javascriptitem.innerText = inputField.valueAdd breakpoint again and step onto the line of code appending
<li>itemInspect item object - you’ll find innerText/innerHTML now has a value
Let's head over to the console and console.log(item) to confirm this
And sure enough the
<li>item has an innerText/innerHTML set
In the above example, we took a step-by-step approach using the event listener breakpoint to debug the JS code that caused the bug.
A similar approach would have been to estimate the problematic lines of code and set a breakpoint directly at the identified line.
How can we make an estimated guess? We can do this by considering roughly where the action failing might be in the source code. If this isn't still clear, head over to the elements panel and set a DOM breakpoint, this will lead to the javascript file in question. We can do this as follows:
Open sources panel → head to file containing code you're interested in debugging
Click on the line number of code you'd like to pause on, and a blue icon should appear showing the breakpoint
Devtools will now pause the script once it reaches the breakpoint defined. Let's look at what's happening under the hood in this approach.
Devtools pauses the script from running after the breakpoint as though the application is frozen in time. console.log(), on the other hand, continues running the rest of the script following the console statements.
Breakpoints allow us to walk through the code one line at a time and inspect all the variables we have access to at that moment in time in the application. This approach is much more detailed than console.log(), which only outputs the variables you decide to print.
Conclusion
In this last instalment of the Intro to devtools blog series, we've explored the following features which help us inspect our application:
Scrolling elements of interest to view
DOM breakpoints
Debugging JS in the sources panel.
Furthermore, we inspected how the JS debugging pane in the sources panel can help us solve bugs related to our JS code.
The features and tools discussed in this series provide insight into how devtools can help us in our daily workflow as frontend developers. As mentioned previously, in this series, we've only touched upon some of the essential tools offered by Chrome Devtools for inspecting your application. Devtools provides a lot more functionality that offers a wealth of insight into the inner workings of your application. These include bugs, performance and memory issues, and network information. To learn more about these tools, check the resources list below.
Devtools series:
Devtools Part 1: Chrome DevTools - a basic overview
Devtools Part 2: Inspecting and editing HTML & CSS
Resources:


